RSS

Rob's Real Estate Board October 2020 Stats for Vancouver

The October 2020 Market stats are out and available for download. You get the following graphs and charts for both Vancouver East and Vancouver West.

  • Activity Snapshot by PropertyType
  • Detached Properties Report and Graph
  • Condo Report and Graph
  • Townhomes Report and Graph
  • Benchmark Price Graph
  • Average Price Per Square Foot

If you are interested in a report like this is for other areas, please contact me to request it and I'll send it to you.

DOWNLOAD BURNABY NORTH STATS

DOWNLOAD NEW WESTMINSTER STATS

DOWNLOAD COQUITLAM STATS

DOWNLOAD TSAWWASSEN STATS

DOWNLOAD RICHMOND STATS

Read

Home sale and listing resurgence extends into the fall

VANCOUVER, BC – November 3, 2020 – Home sale and new listing activity remained at near record levels across Metro Vancouver* in October.

The Real Estate Board of Greater Vancouver (REBGV) reports that residential home sales in the region totalled 3,687 in October 2020, a 29 per cent increase from the 2,858 sales recorded in October 2019, and a 1.2 per cent increase from the 3,643 homes sold in September 2020.

Last month’s sales were 34.7 per cent above the 10-year October sales average and stands as the second-highest total on record for the month.

“Home has been a focus for residents during the pandemic. With more days and evenings spent at home this year, people are re-thinking their housing situation," Colette Gerber, REBGV Chair said. “Throughout this period, REALTORS® have been working to understand and adapt to the latest safety protocols so that they can continue to help the public meet their housing needs in a safe and responsible way.”

There were 5,571 detached, attached and apartment homes newly listed for sale on the Multiple Listing Service® (MLS®) in Metro Vancouver in October 2020. This represents a 36.7 per cent increase compared to the 4,074 homes listed in October 2019 and a 13 per cent decrease compared to September 2020 when 6,402 homes were listed.

The total number of homes currently listed for sale on the MLS® system in Metro Vancouver is 12,416, a 1.5 per cent increase compared to October 2019 (12,236) and a 5.2 per cent decrease compared to September 2020 (13,096).

“With demand on the rise, homes priced right for today’s market are receiving attention and, at times, garnering multiple offers," Gerber said. "To understand the market conditions in your neighbourhood and property type of choice, work with your local REALTOR® to assess the latest MLS® housing market information."

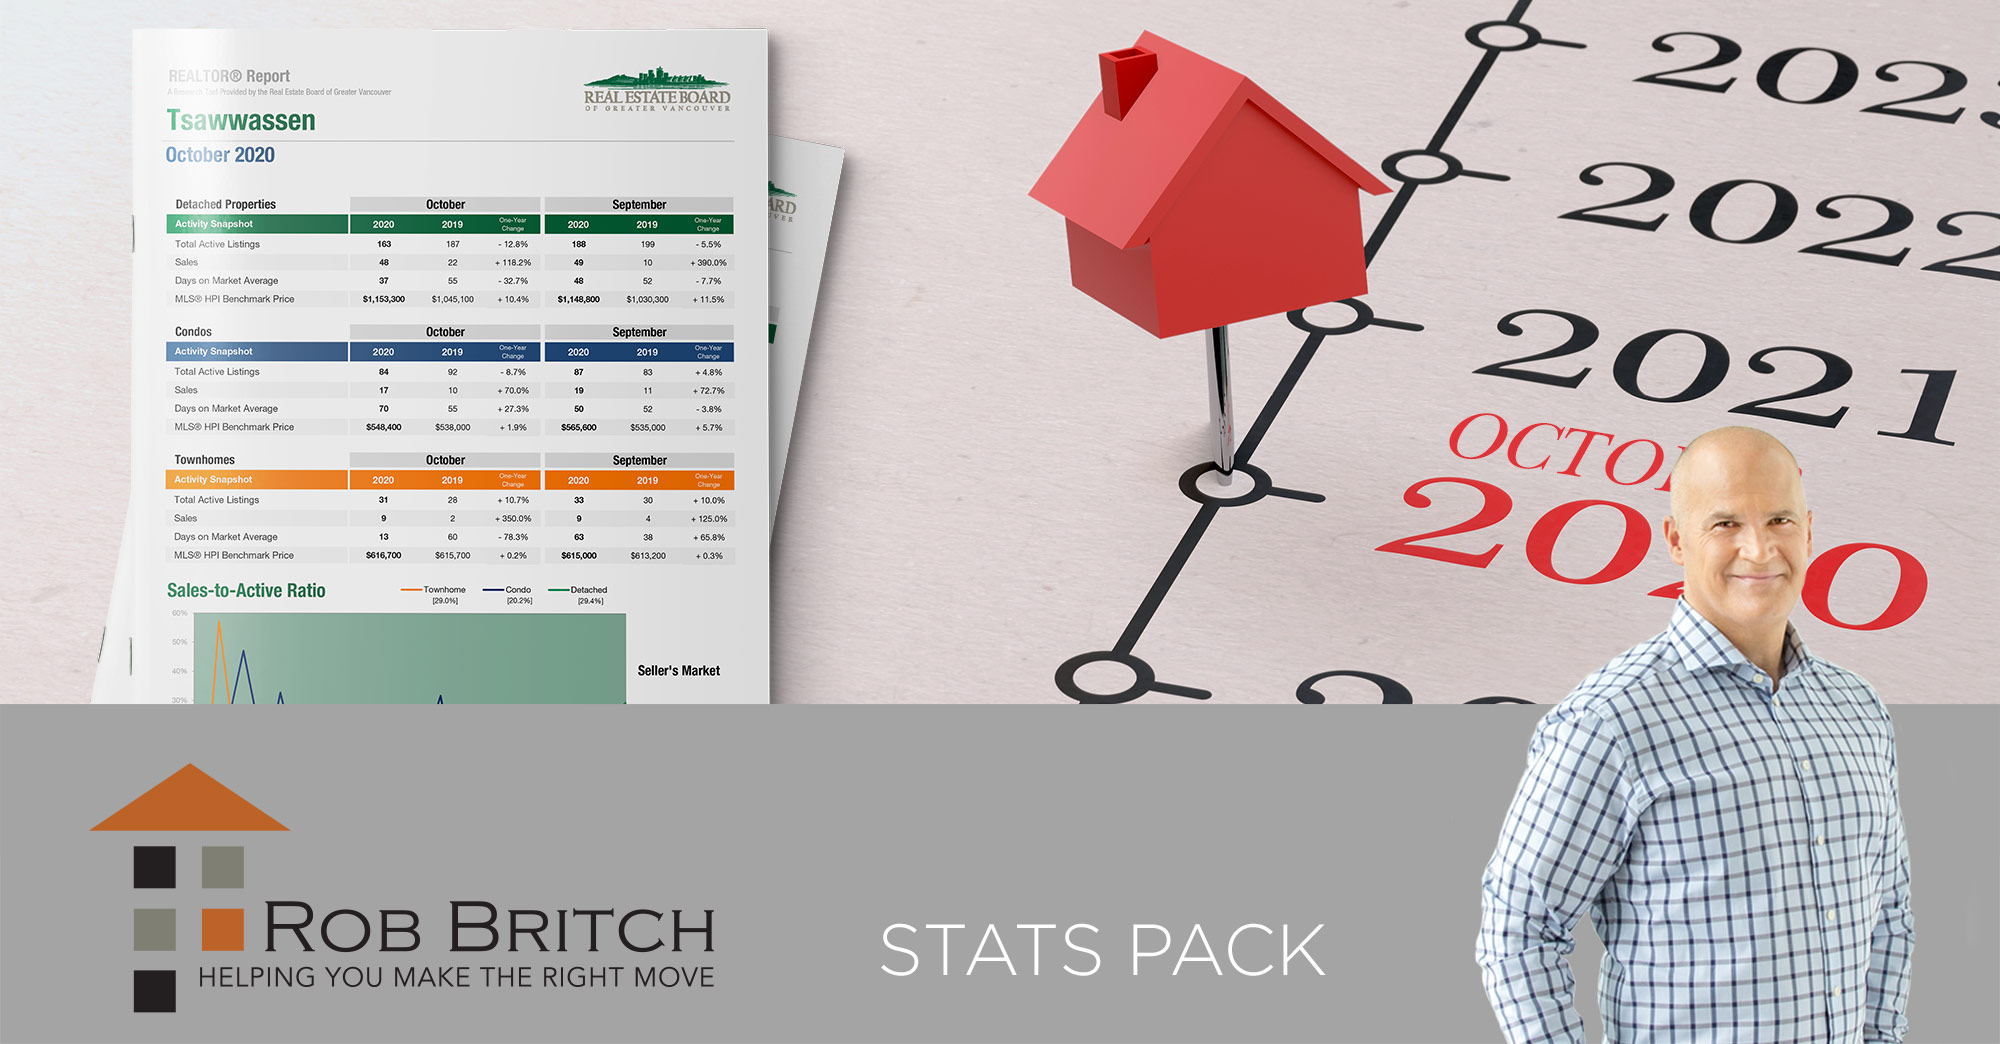
For all property types, the sales-to-active listings ratio for October 2020 is 29.7 per cent. By property type, the ratio is 30.9 per cent for detached homes, 43.5 per cent for townhomes, and 24.9 per cent for apartments.

Generally, analysts say downward pressure on home prices occurs when the ratio dips below 12 per cent for a sustained period, while home prices often experience upward pressure when it surpasses 20 per cent over several months.

The MLS® Home Price Index composite benchmark price for all residential properties in Metro Vancouver is currently $1,045,100. This represents a six per cent increase over October 2019 and a 0.4 per cent increase compared to September 2020.

Sales of detached homes in October 2020 reached 1,335, a 42.3 per cent increase from the 938 detached sales recorded in October 2019. The benchmark price for a detached home is $1,523,800. This represents an 8.5 per cent increase from October 2019 and a 1.1 per cent increase compared to September 2020.

Sales of apartment homes reached 1,570 in October 2020, a 13.4 per cent increase compared to the 1,384 sales in October 2019. The benchmark price of an apartment property is $683,500. This represents a 4.4 per cent increase from October 2019 and is unchanged compared to September 2020.

Attached home sales in October 2020 totalled 782, a 45.9 per cent increase compared to the 536 sales in October 2019. The benchmark price of an attached home is $813,000. This represents a 5.4 per cent increase from October 2019 and a 0.4 per cent increase compared to September 2020.

REBGV Stats Graph October 2020

GET THIS FULL REPORT

Read
Categories:   Annieville, N. Delta Real Estate | Beach Grove, Tsawwassen Real Estate | Big Bend, Burnaby South Real Estate | Boulevard, North Vancouver Real Estate | Bowen Island, Bowen Island Real Estate | Boyd Park, Richmond Real Estate | Brentwood Park, Burnaby North Real Estate | Bridgeport RI, Richmond Real Estate | Brighouse South, Richmond Real Estate | Brighouse, Richmond Real Estate | Burnaby Hospital, Burnaby South Real Estate | Cambie, Vancouver West Real Estate | Caulfeild, West Vancouver Real Estate | Champlain Heights, Vancouver East Real Estate | Chilliwack E Young-Yale, Chilliwack Real Estate | Clayton, Cloverdale Real Estate | Cloverdale BC, Cloverdale Real Estate | Collingwood VE, Vancouver East Real Estate | Coquitlam West, Coquitlam Real Estate | Deep Cove, North Vancouver Real Estate | Downtown VW, Vancouver West | Downtown VW, Vancouver West Real Estate | East Cambie, Richmond Real Estate | East Richmond, Richmond Real Estate | English Bluff, Tsawwassen Real Estate | Fairview VW, Vancouver West | Fairview VW, Vancouver West Real Estate | False Creek North Real Estate | False Creek North, Vancouver West Real Estate | False Creek, Vancouver West Real Estate | Fraser VE, Vancouver East Real Estate | Fraserview VE, Vancouver East Real Estate | Gilmore, Richmond Real Estate | Grandview Woodland, Vancouver East Real Estate | Guildford, North Surrey Real Estate | Hastings, Vancouver East Real Estate | Hawthorne, Ladner Real Estate | Heritage Woods PM, Port Moody Real Estate | Indian River, North Vancouver Real Estate | Ironwood, Richmond Real Estate | Killarney VE, Vancouver East Real Estate | Kitsilano, Vancouver West | Kitsilano, Vancouver West Real Estate | Knight, Vancouver East Real Estate | Ladner Elementary, Ladner Real Estate | Langley City, Langley Real Estate | Lower Lonsdale, North Vancouver Real Estate | Main, Vancouver East Real Estate | Marpole, Vancouver West Real Estate | McLennan North, Richmond Real Estate | Morgan Creek, South Surrey White Rock Real Estate | Mount Pleasant VE, Vancouver East | Mount Pleasant VE, Vancouver East Real Estate | Mount Pleasant VW, Vancouver West Real Estate | New Westminster Real Estate | Point Grey, Vancouver West Real Estate | Queen Mary Park Surrey, Surrey Real Estate | Queensborough, New Westminster Real Estate | Quilchena, Vancouver West Real Estate | Renfrew VE, Vancouver East Real Estate | Riverdale RI, Richmond Real Estate | Sardis West Vedder Rd, Sardis Real Estate | Seafair, Richmond Real Estate | Seymour, North Vancouver Real Estate | South Cambie, Vancouver West Real Estate | South Granville, Vancouver West Real Estate | South Marine, Vancouver East Real Estate | South Slope, Burnaby South Real Estate | South Vancouver, Vancouver East Real Estate | Steveston North, Richmond Real Estate | Steveston South, Richmond Real Estate | Strathcona, Vancouver East Real Estate | Sullivan Station, Surrey Real Estate | Sunshine Hills Woods, N. Delta Real Estate | Surrey Real Estate | Tsawwassen Central, Tsawwassen Real Estate | Tsawwassen East, Tsawwassen Real Estate | University VW, Vancouver West Real Estate | Uptown NW, New Westminster Real Estate | Vancouver Market Report | Vancouver Real Estate | Victoria VE, Vancouver East Real Estate | West Cambie, Richmond Real Estate | West End VW Real Estate | West End VW, Vancouver West Real Estate | West Newton, Surrey | West Newton, Surrey Real Estate | Whalley, North Surrey Real Estate | White Rock, South Surrey White Rock Real Estate | Woodwards, Richmond Real Estate | Yaletown, Vancouver West Real Estate
Reciprocity Logo The data relating to real estate on this website comes in part from the MLS® Reciprocity program of either the Greater Vancouver REALTORS® (GVR), the Fraser Valley Real Estate Board (FVREB) or the Chilliwack and District Real Estate Board (CADREB). Real estate listings held by participating real estate firms are marked with the MLS® logo and detailed information about the listing includes the name of the listing agent. This representation is based in whole or part on data generated by either the GVR, the FVREB or the CADREB which assumes no responsibility for its accuracy. The materials contained on this page may not be reproduced without the express written consent of either the GVR, the FVREB or the CADREB.